Distance Colour Map
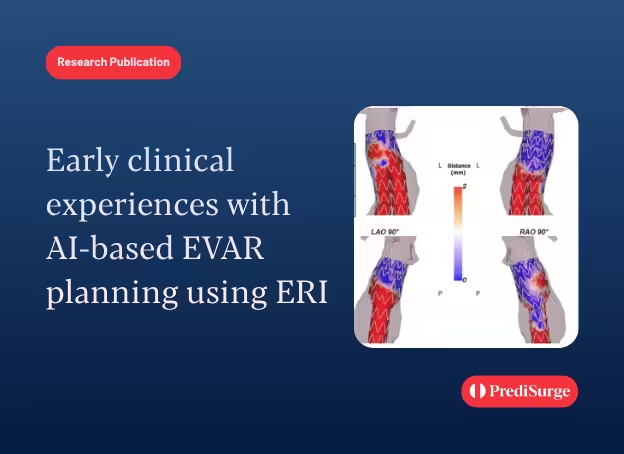
Instantly highlights the critical apposition gaps between the aortic wall and the graft. Switch between simulations and select the optimal configuration for your patient.
*NOT FOR CLINICAL USE
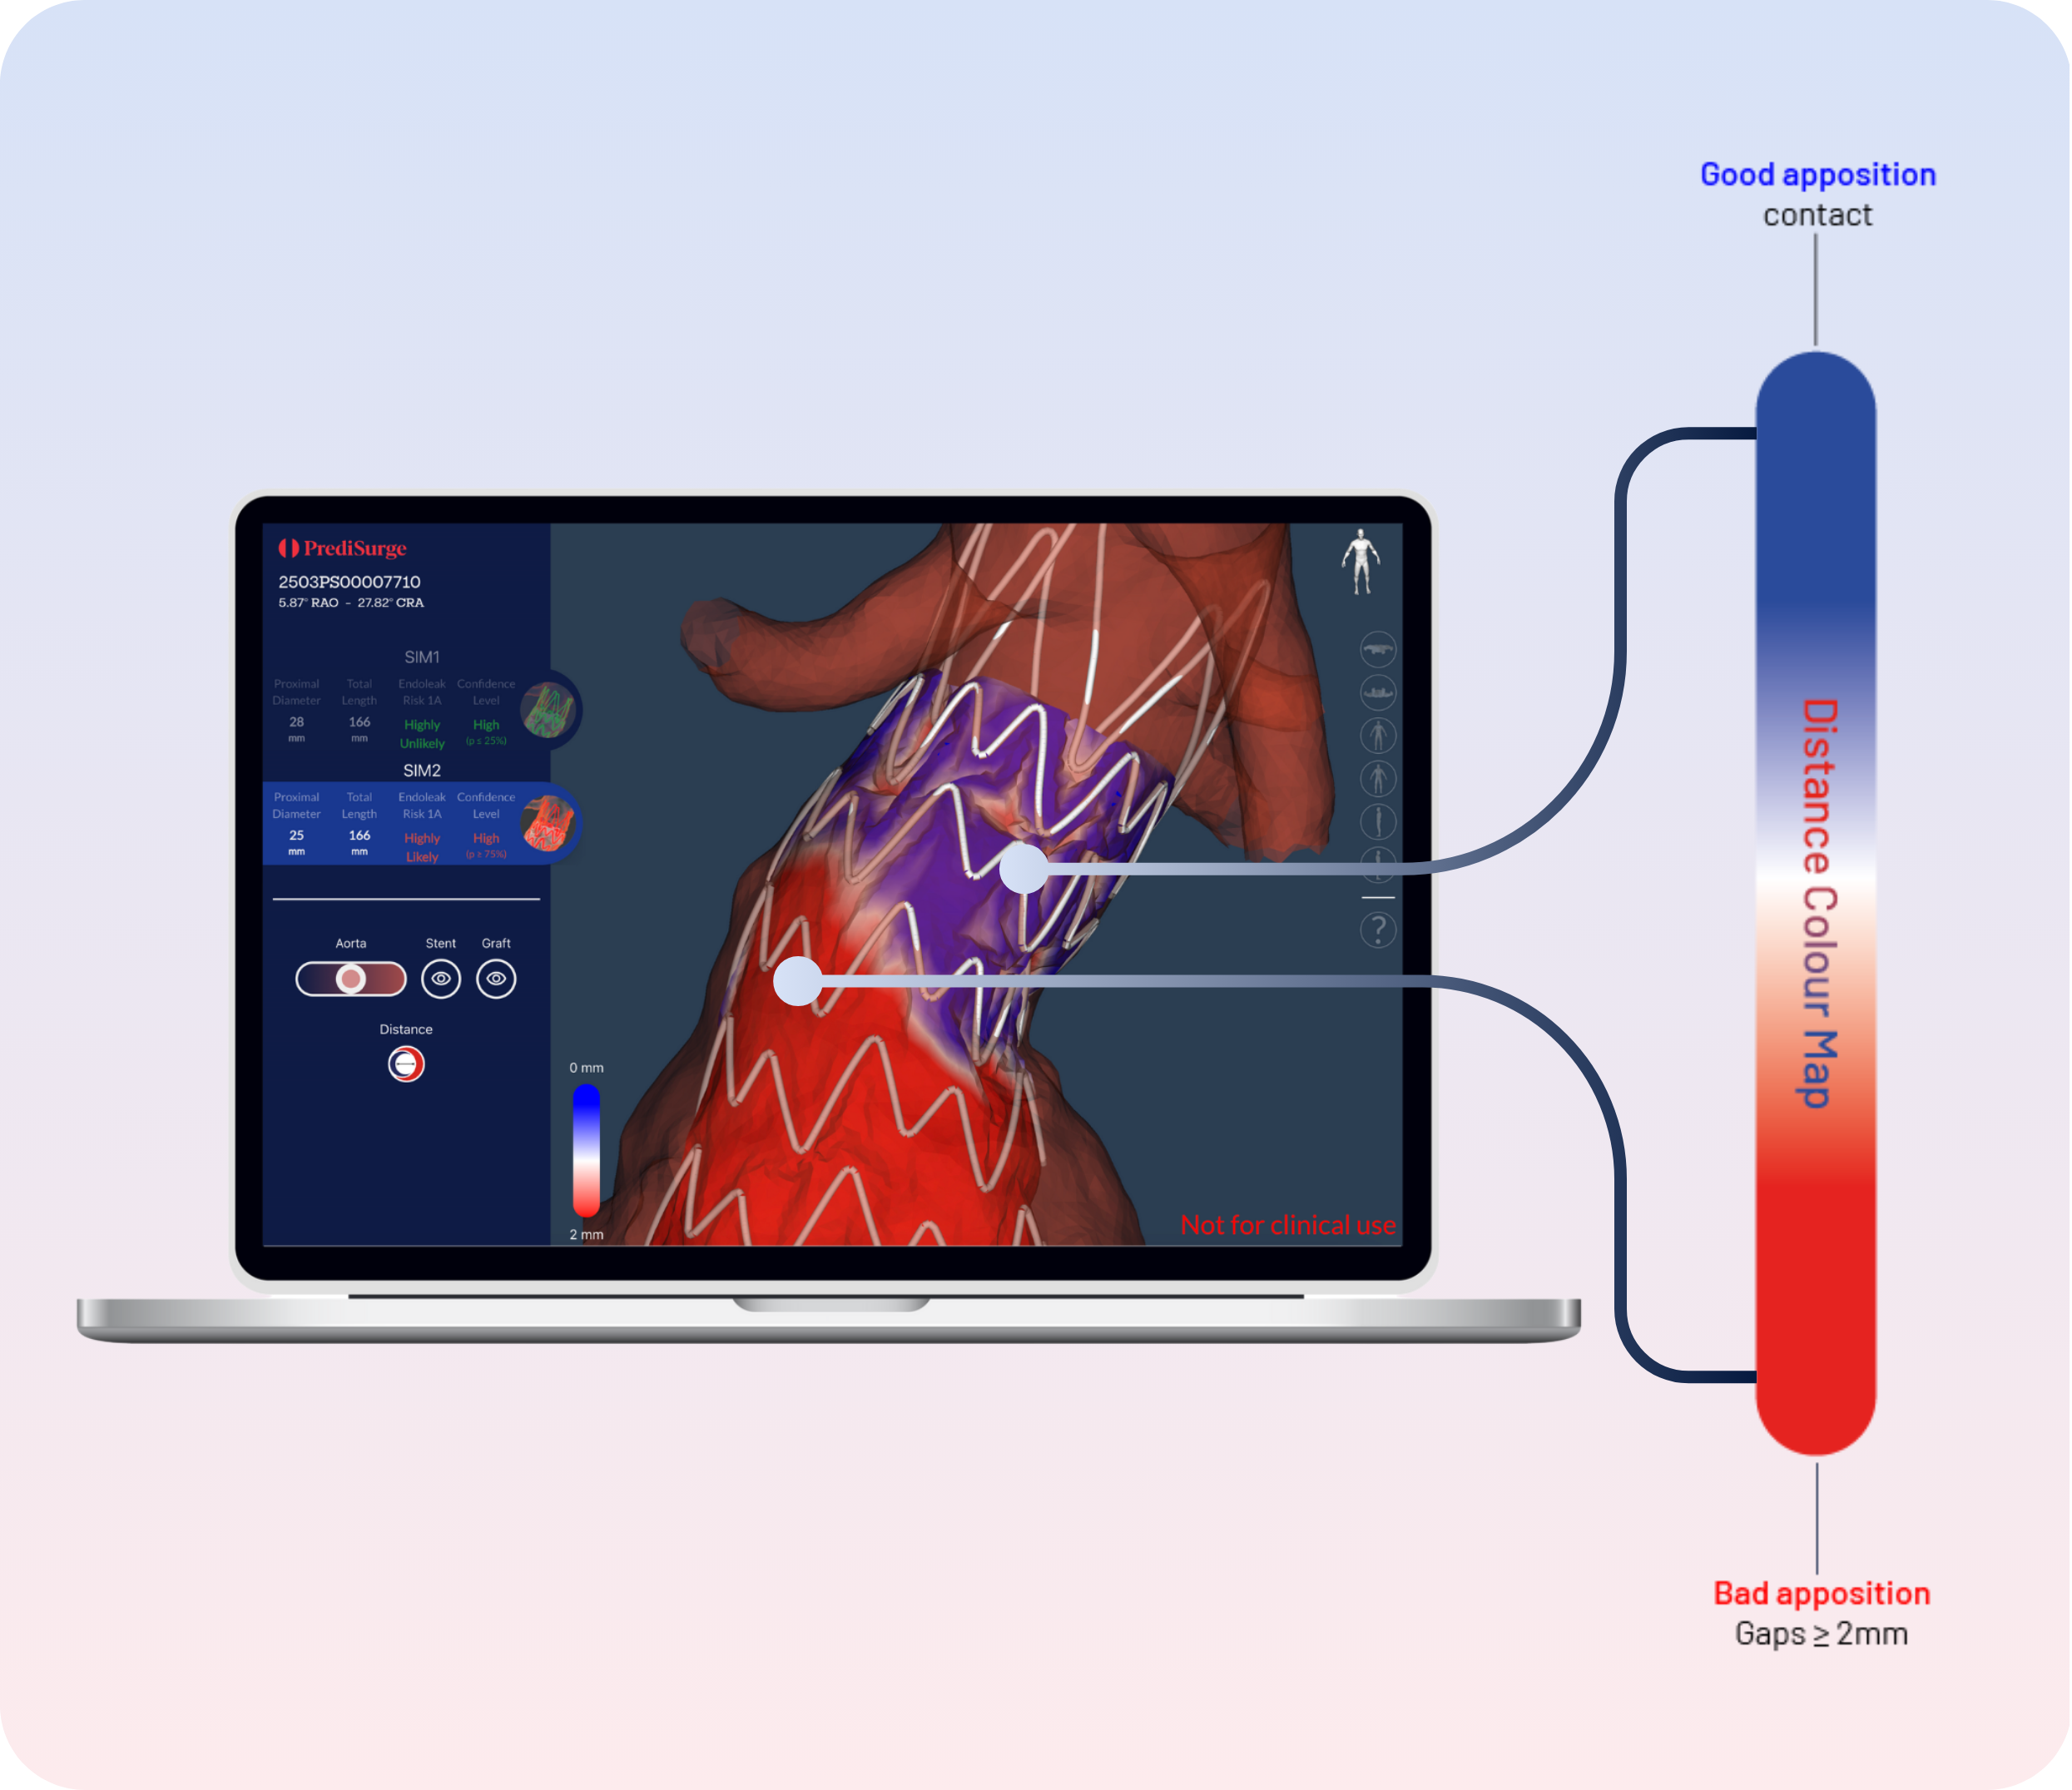
Identify potential risk of endoleak
Designed to complement the Endoleak Risk Index (ERI), the Distance Colour Map is a heatmap that show the apposition gap between the graft and the aortic wall.
.png)
AI-Powered EVAR Planning
Endoleak Risk Index (ERI)
ERI-Endoleak Risk Index is an AI- powered index generated using 16,000 data points measured on the proximal neck.
ERI estimates endoleak risk with simulated endograft sizes, guiding surgeons toward optimal device selection to reduce the chances of complications.

The expert perspective
First-hand experience from operating rooms to R&D labs — professionals trust PrediSurge to improve outcomes, enhance safety, and accelerate innovation.





.webp)


Clinical Stories
Insights from clinical and R&D practice, directly from our experts
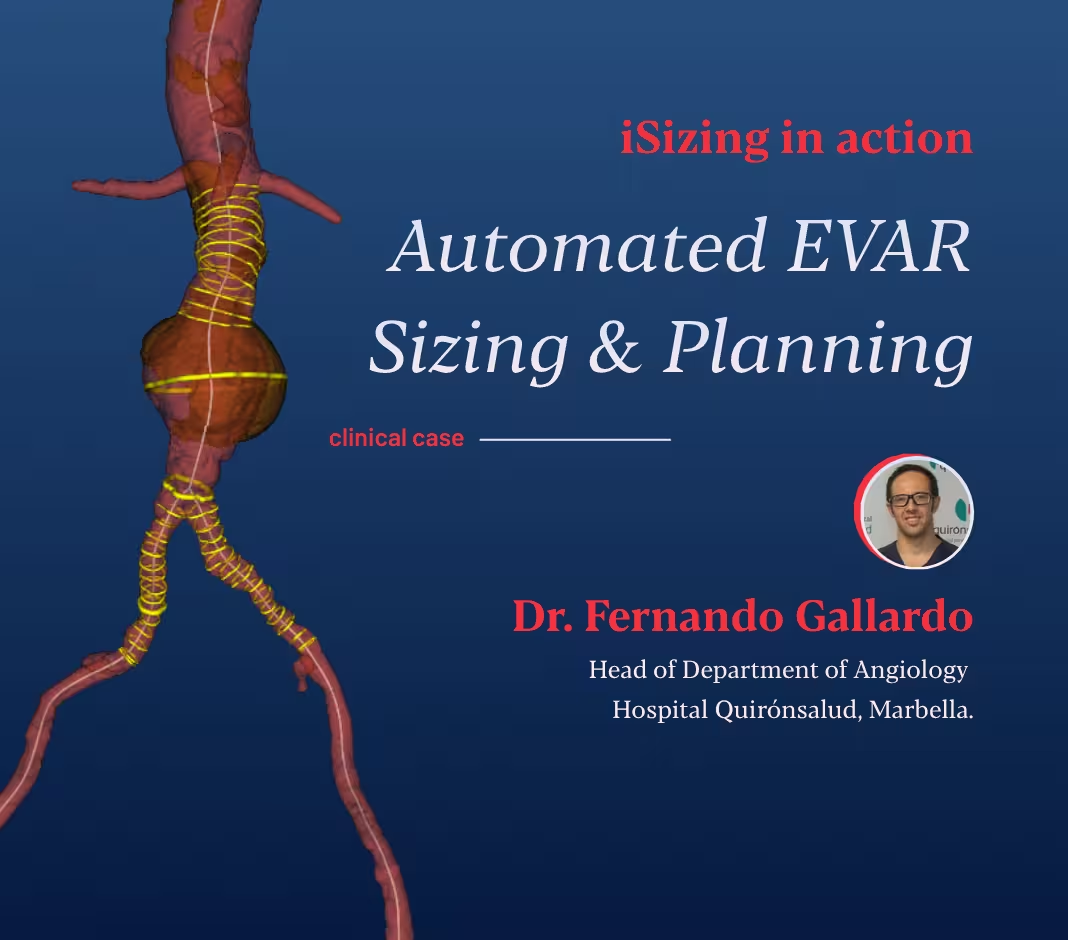

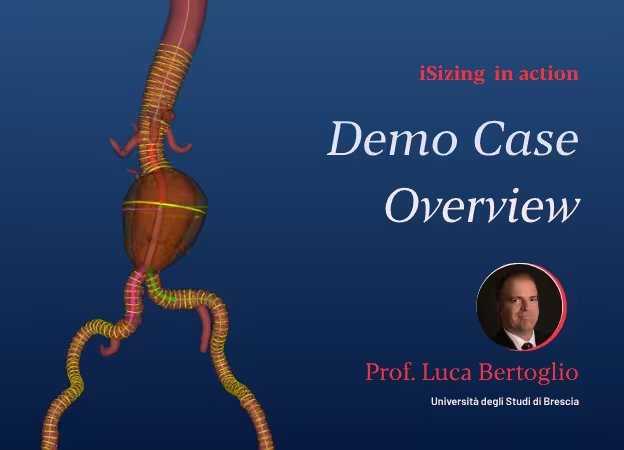
iSizing in action
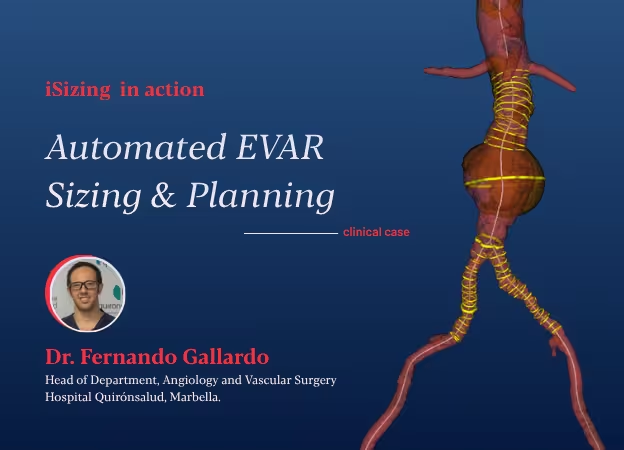
This case was presented with abdominal pain and local tenderness on palpation, the CT findings were: an abdominal aortic aneurysm that had grown from 4.0 cm to 4.7 cm in just three months.
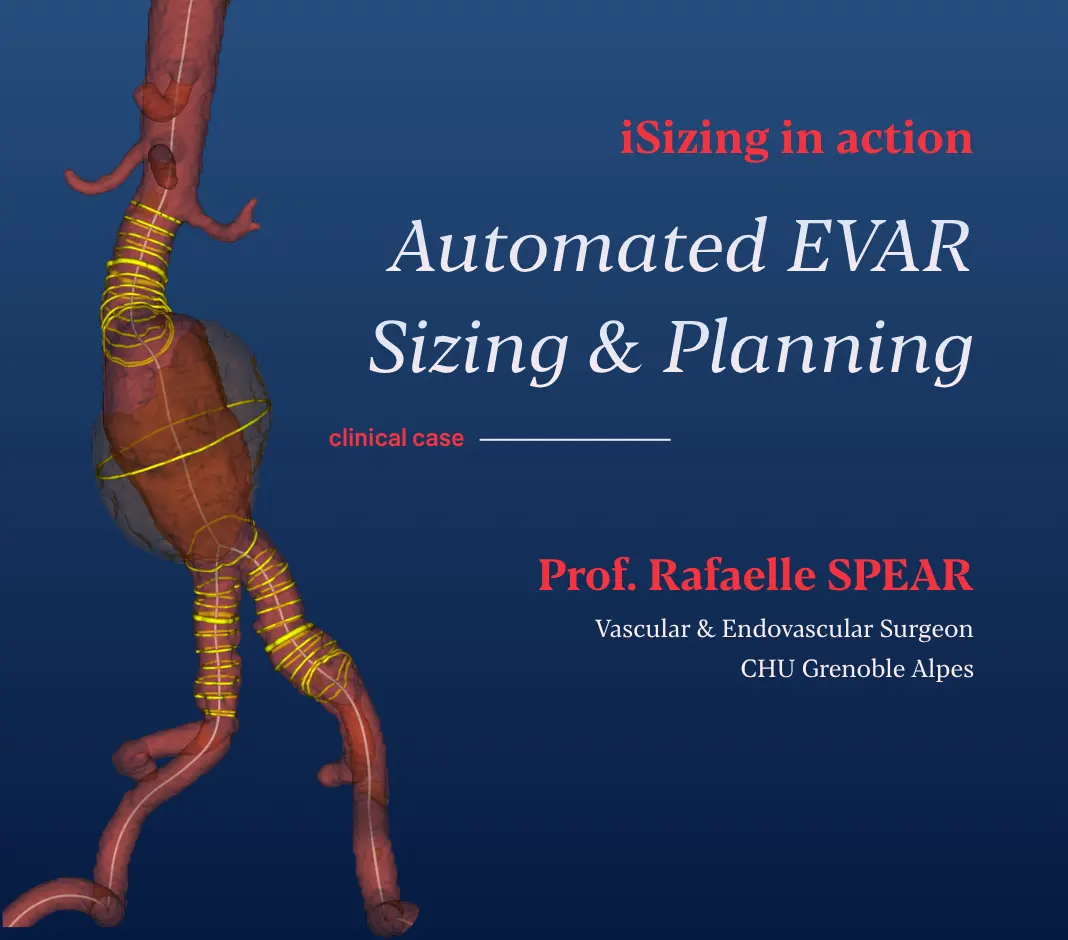

iSizing in action
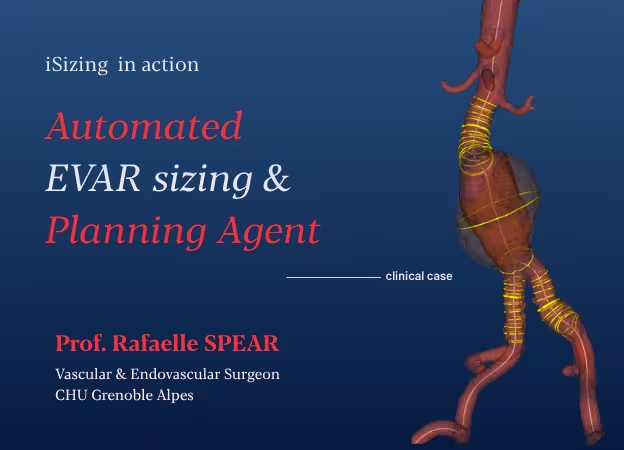
In this Case of the Month, Prof. Rafaelle Spear takes us through how automated sizing and interactive planning come together inside iSizing on a real abdominal aortic aneurysm case at CHU Grenoble Alpes — from CT to a fully specified endograft configuration.
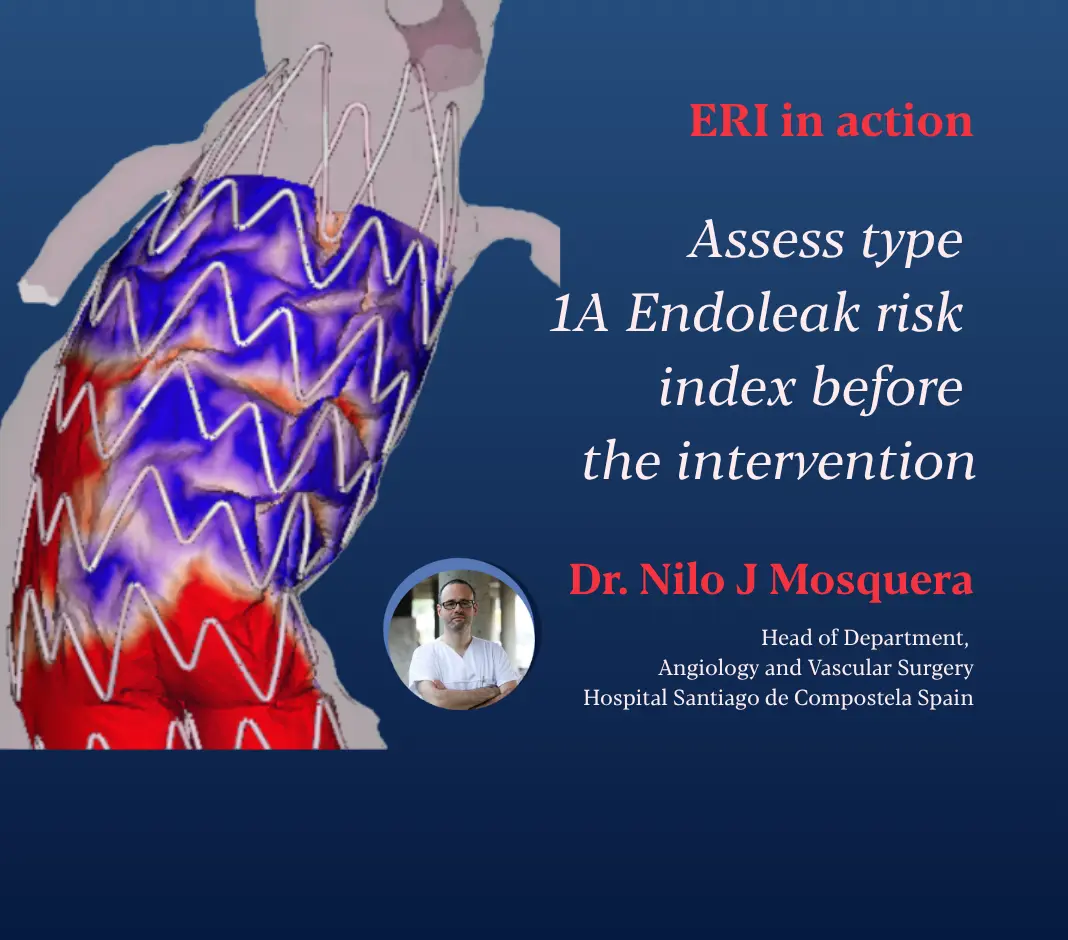
ERI in action
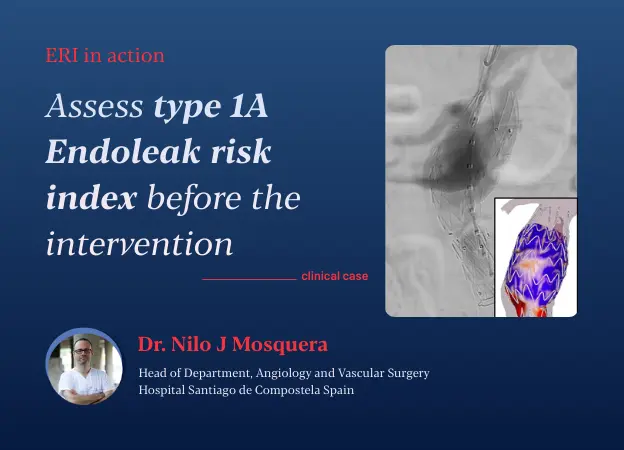
This case, presented by Dr. Nilo J. Mosquera from Hospital Santiago de Compostela, Spain, highlights how a hostile proximal neck can be managed using ERI to leverage AI-powered Digital Twin technology, enhancing clinical decision-making and improving patient outcomes.
Press highlights & Insights
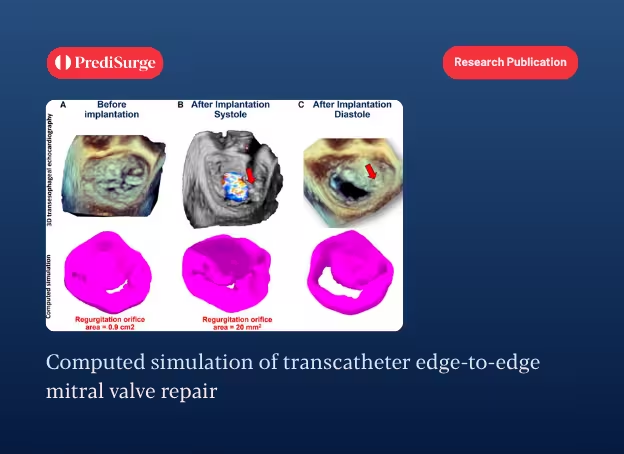
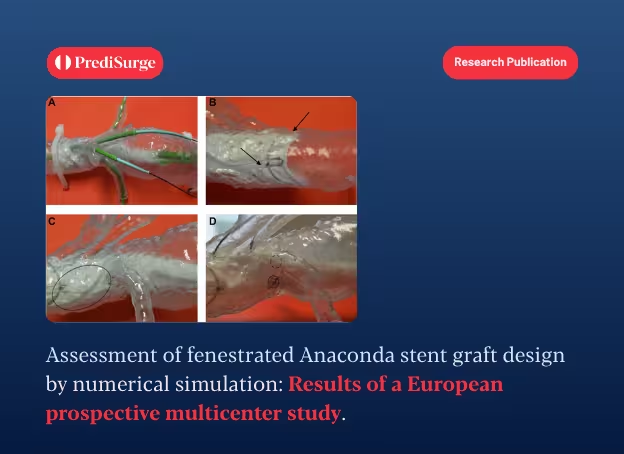
Independent recognition through clinical research and media coverage and PrediSurge insights















Frequently asked questions
What is aortic digital twin?
From a patient’s pre-operative CT scan, the aortic digital twin is created to faithfully reproduce both the shape and the bio mechanical behavior of the real aorta. This advanced 3D model allows precise simulation of how the patient’s anatomy responds to mechanical forces, providing a reliable virtual counterpart of the vessel.
What is ERI?
ERI stands for Endoleak Risk Index, is an AI-powered index based on the analysis of the intervention simulation, with a specific focus on the proximal apposition between the endograft and the patient-specific aortic digital twin. It assesses preoperatively the risk of Type IA endoleak associated with EVAR.
How is ERI calculated?
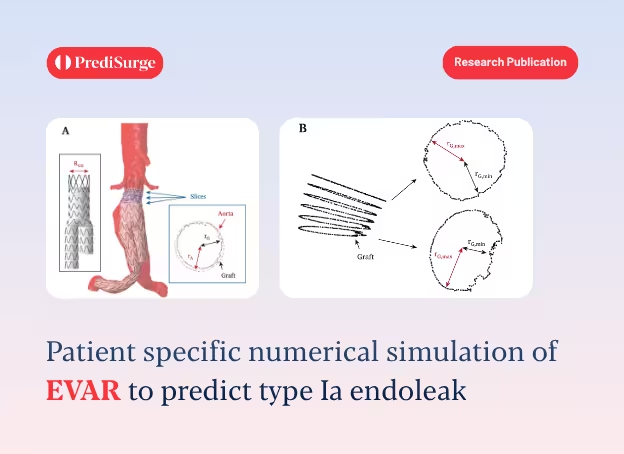
Each EVAR simulation automatically analyses the proximal aortic neck using 40 cross-sectional slices. For each slice, the aortic wall and endograft are sampled at 200 points each to measure local radii and apposition. This generates up to 16,000 detailed measurements per patient.
Are thrombus and calcifications taken into account?
It is important to distinguish between two different stages of analysis:
- Simulation: Only the aortic lumen is modeled; thrombus and calcifications are not yet included.
- Risk assessment (ERI): Thrombus burden is included as a variable in the machine-learning model used to compute risk.
How do we simulate EVAR implantation?
- Step 1: Creation of Digital Twin of Aorta
- Step 2: Digital Replica of Endograft
- Step 3: Simulating the implantation of Endograft
For detailed information: click here
How is EVAR simulation validated?
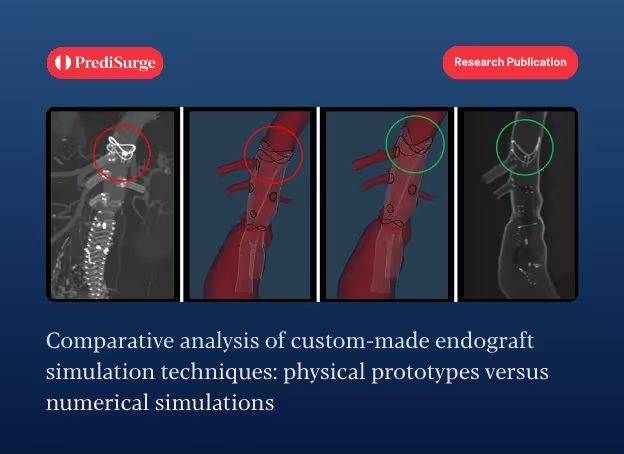
To validate the accuracy of EVAR simulations, retrospective studies were performed on patients who had previously undergone EVAR. For each case, the pre-operative CT scan was used to generate a patient-specific digital twin of the aorta. The procedure was then simulated virtually using the same Endurant endograft reference and identical landing zones as those employed during the actual intervention.
Clinical Evidence of ERI
To validate the ERI in a clinical setting, a multi-centric retrospective study — EnduSim— was conducted across several European centers. Consecutive patients who underwent EVAR with Medtronic Endurant II devices were analysed and subsequently divided into two groups:
- Patients with type Ia Endoleak (EL1A)
- Control patients
For more detailed information,